Python / "Jupyter Notebook" & "HTTP API" - MWE client example
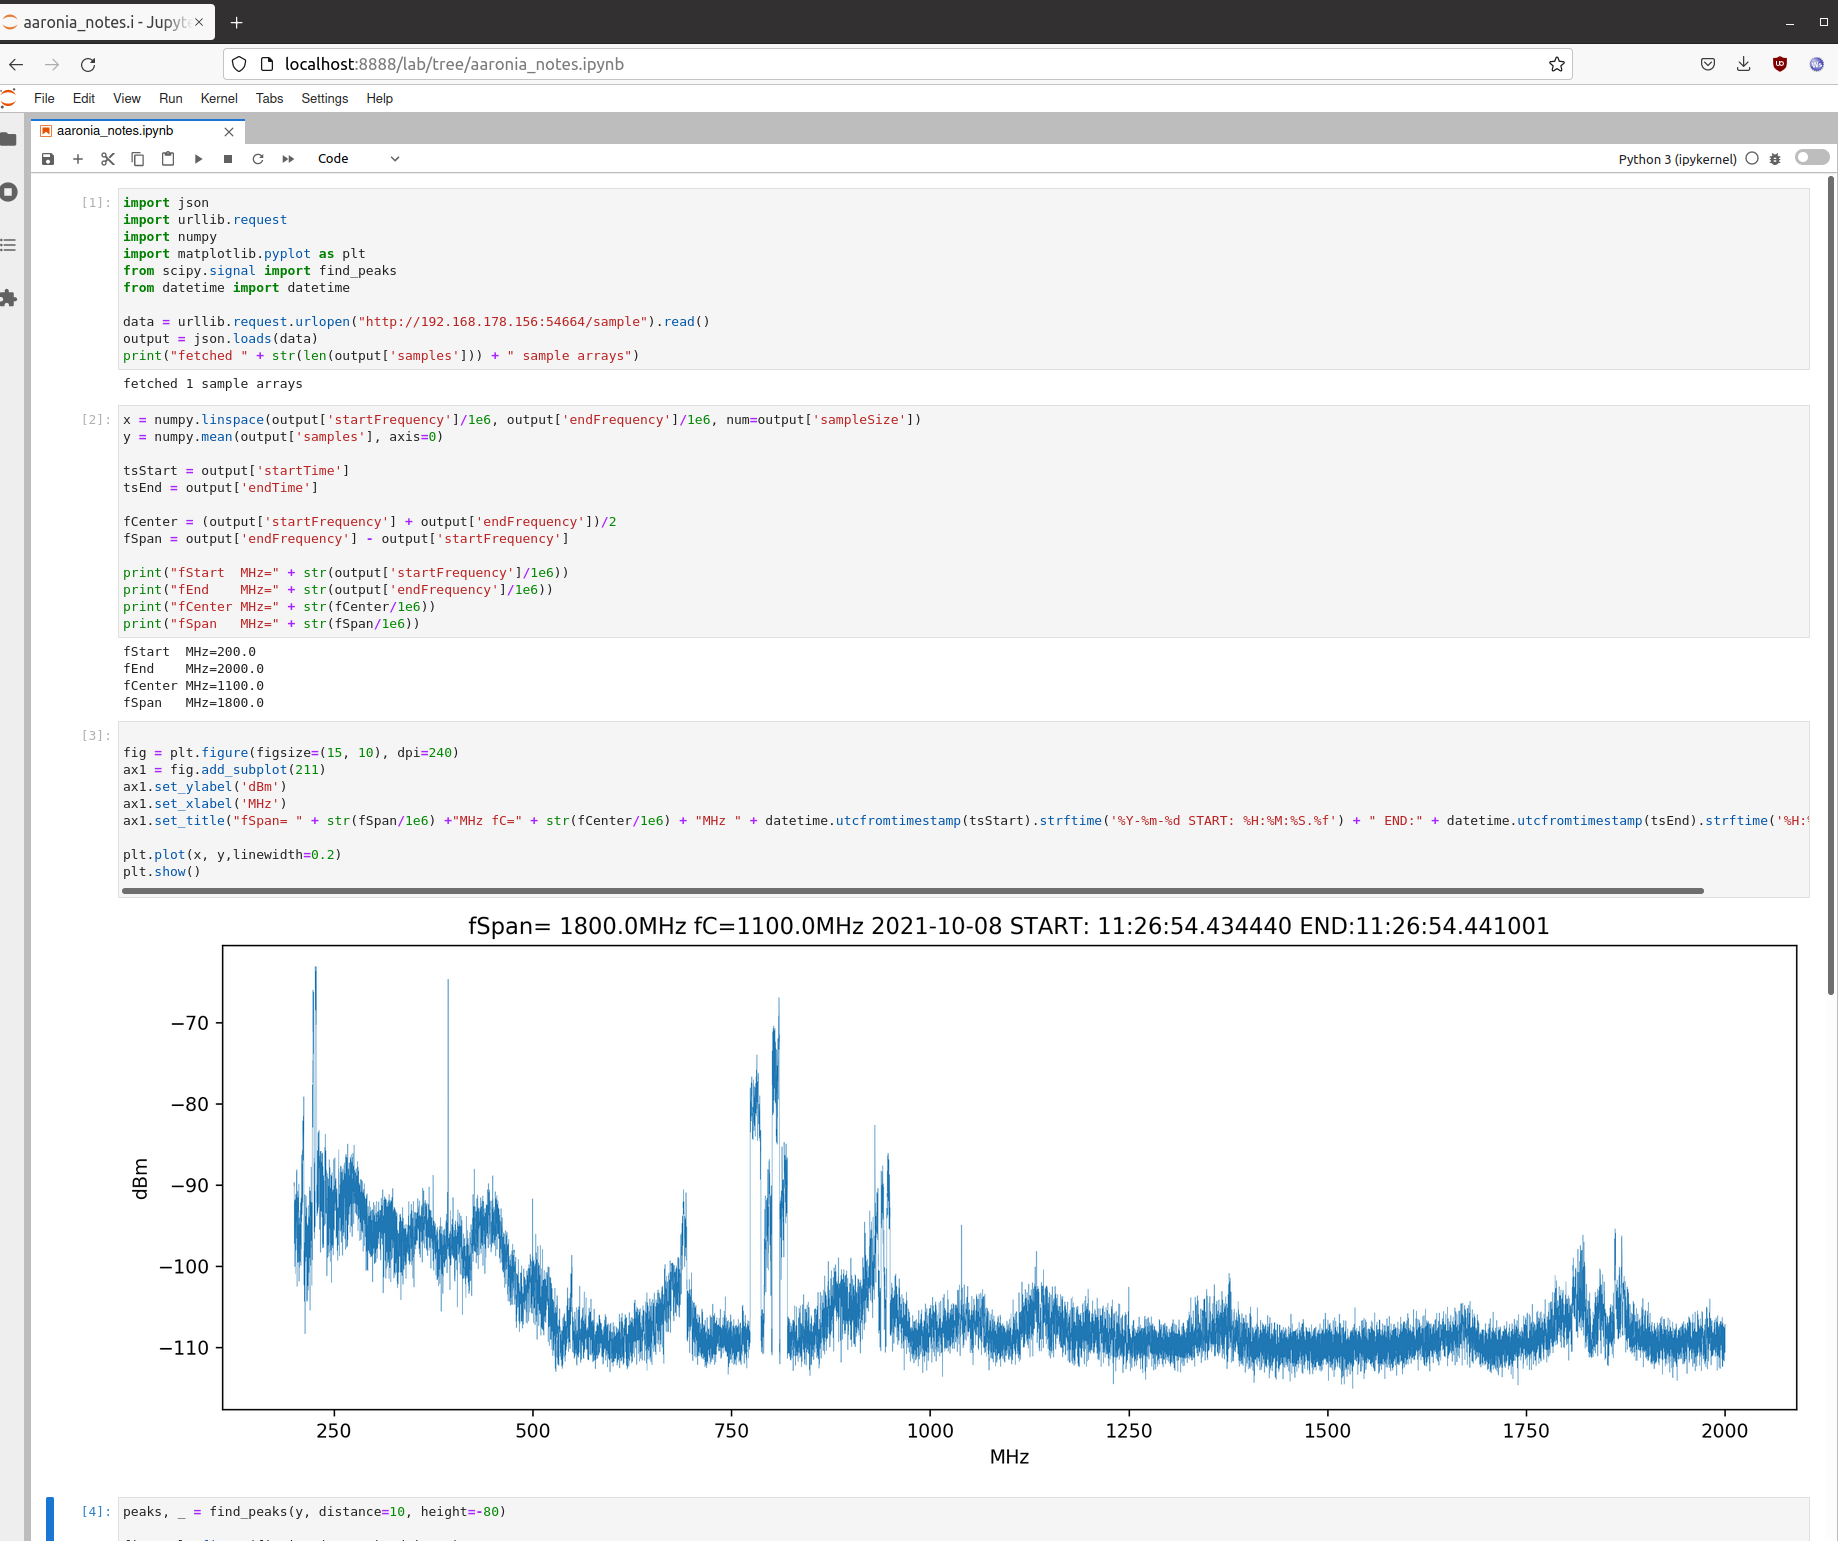
Quote from fw_dev on 08/10/2021, 13:40This ipynb Jupyter Notebook shows a minimal working example, a way how I pull spectra data from the "HTTP Server" block for e.g. to use with numpy/scipy/matplotlib
This ipynb Jupyter Notebook shows a minimal working example, a way how I pull spectra data from the "HTTP Server" block for e.g. to use with numpy/scipy/matplotlib


Quote from Tom on 04/12/2022, 11:40Thanks for that very helpful post!
Is there a way to also get the timestamp for each single frequency measured?
If yes, how this can be achieved?
BG Tom
Thanks for that very helpful post!
Is there a way to also get the timestamp for each single frequency measured?
If yes, how this can be achieved?
BG Tom
Quote from fw_dev on 05/12/2022, 09:33I hope I got your question right, but in the example you already receive the "startTime" and "endTime" along with the "sampleSize" element.
I hope I got your question right, but in the example you already receive the "startTime" and "endTime" along with the "sampleSize" element.
Quote from Tom on 06/12/2022, 19:42Well, that information might help and it might be possible to do some time calculations or estimates at which point of time an RF-measurement was performed.
I am coming from a measurement domain, where always RF measurements are performed at defined frequencies. Once a measurement is completed the next measurement frequency is selected. So it is possible to state a point of time when the measurement at a defined frequency was performed.
In the SA domain things appear different, because over a short time period a waveform of a received RF-signal is digitized and then transformed by FFT into the frequency domain providing amplitude- and phase values of numerous frequency points depending e.g. on the FFT resolution. Saying that, then it can only be stated that the amplitude- and phase values for a dedicated frequency where existing within the time frame where the signal was digitized?
Since we intend to measure with frequency bandwidths of less than 200 MHz the digitization time frame should be rather small.
Possibly the knowledge of this time frame would be accurate enough for our application to merge data by time stamps with an independent sensor during post processing.
Could you pls. state a typical time frame to be considered for a bandwidth of e.g. 160 or 200 MHz?
Sorry for being a bit "off-topic" for this post here.
Well, that information might help and it might be possible to do some time calculations or estimates at which point of time an RF-measurement was performed.
I am coming from a measurement domain, where always RF measurements are performed at defined frequencies. Once a measurement is completed the next measurement frequency is selected. So it is possible to state a point of time when the measurement at a defined frequency was performed.
In the SA domain things appear different, because over a short time period a waveform of a received RF-signal is digitized and then transformed by FFT into the frequency domain providing amplitude- and phase values of numerous frequency points depending e.g. on the FFT resolution. Saying that, then it can only be stated that the amplitude- and phase values for a dedicated frequency where existing within the time frame where the signal was digitized?
Since we intend to measure with frequency bandwidths of less than 200 MHz the digitization time frame should be rather small.
Possibly the knowledge of this time frame would be accurate enough for our application to merge data by time stamps with an independent sensor during post processing.
Could you pls. state a typical time frame to be considered for a bandwidth of e.g. 160 or 200 MHz?
Sorry for being a bit "off-topic" for this post here.
Quote from AdminTC on 06/12/2022, 21:19Yes, this is total off-topic.
Please start a new thread and search the forum first e.g., https://v6-forum.aaronia.de/forum/search/?keywords=Timestamp
Yes, this is total off-topic.
Please start a new thread and search the forum first e.g., https://v6-forum.aaronia.de/forum/search/?keywords=Timestamp
Quote from Tom on 08/12/2022, 13:02Yes I can do so.
One more on-topic question pls..
In the python code shown above in section [3] the line 5 is not completely visible at the right end.
Is there any chance to get the missing line information?
Yes I can do so.
One more on-topic question pls..
In the python code shown above in section [3] the line 5 is not completely visible at the right end.
Is there any chance to get the missing line information?
Quote from AdminTC on 08/12/2022, 14:06I don't think so since this is just a simple "hack" to show that it works.
With a bit of code knoledge it should be simple to add what is needed to run this code.
I don't think so since this is just a simple "hack" to show that it works.
With a bit of code knoledge it should be simple to add what is needed to run this code.
Quote from fw_dev on 08/12/2022, 14:13True, did not save the code and the line in question is anyway just setting the title of the chart, so nothing fancy going on there. It was just to illustrate the idea of how to interact with the RTSA HTTP.
True, did not save the code and the line in question is anyway just setting the title of the chart, so nothing fancy going on there. It was just to illustrate the idea of how to interact with the RTSA HTTP.
Quote from Tom on 08/02/2023, 23:51Is it possible to obtain via the "HTTP Server" block also the real- and imaginary parts or the magnitude- and phase values per frequency point of the power spectrum as indicated below of a.m. example? If yes, how this can be achieved?
Is it possible to obtain via the "HTTP Server" block also the real- and imaginary parts or the magnitude- and phase values per frequency point of the power spectrum as indicated below of a.m. example? If yes, how this can be achieved?

Quote from mm_dev on 09/02/2023, 09:26You can get the raw IQ data out of the Spectran V6 if you connect the HTTP Server directly to its IQStream output, see https://v6-forum.aaronia.de/wp-content/uploads/asgarosforum/32/RTSA-http-Stream-Server-Endpoints-8.pdf for details on the format and parameters.
This will however limit your frequency range to the realtime bandwidth of the Spectran V6 or less (depending on configured IQ Rate and Span Factor) unless you implement your own control code for sweeping.
You can get the raw IQ data out of the Spectran V6 if you connect the HTTP Server directly to its IQStream output, see https://v6-forum.aaronia.de/wp-content/uploads/asgarosforum/32/RTSA-http-Stream-Server-Endpoints-8.pdf for details on the format and parameters.
This will however limit your frequency range to the realtime bandwidth of the Spectran V6 or less (depending on configured IQ Rate and Span Factor) unless you implement your own control code for sweeping.