Long Time Recording | Data reduction | Excel Export
Quote from aminucd on 01/12/2022, 00:37Thank you for your reply, perhaps I could explain better using the attached files.
WF1 is a screen shot of the waterfall data. The difference between two consecutive time is calculated in WF2. It means that (for a fixed compression ratio) data was taken ~every 26.7s but not always there are 28.23s and 26.80s time intervals. Can I improve this? so all data is consistently taken every 26.70 s for instance.
Best, A.
Thank you for your reply, perhaps I could explain better using the attached files.
WF1 is a screen shot of the waterfall data. The difference between two consecutive time is calculated in WF2. It means that (for a fixed compression ratio) data was taken ~every 26.7s but not always there are 28.23s and 26.80s time intervals. Can I improve this? so all data is consistently taken every 26.70 s for instance.
Best, A.
Uploaded files: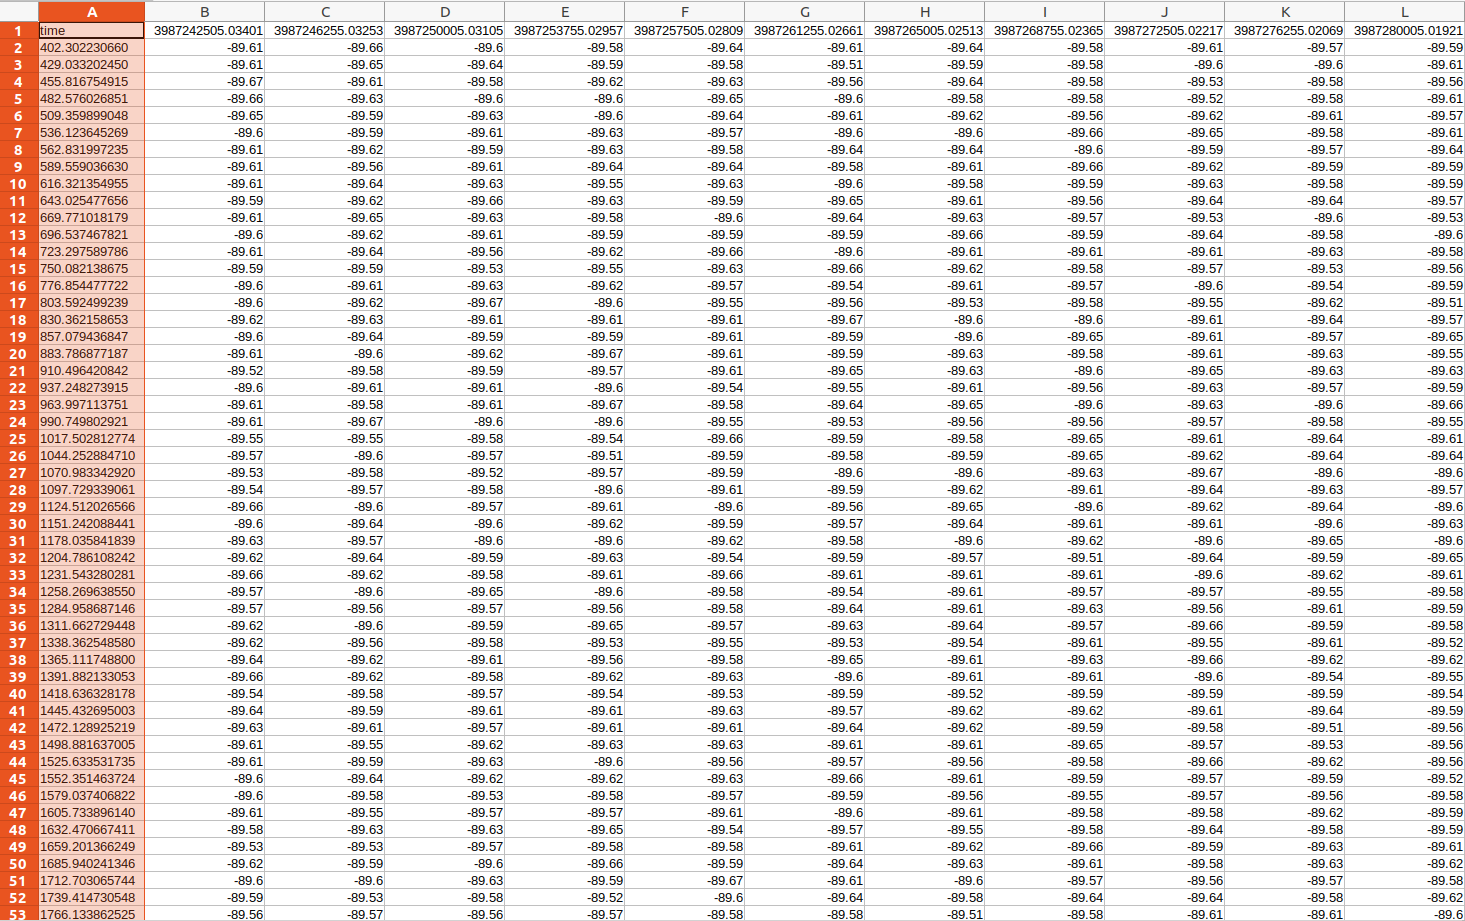

Quote from aminucd on 08/12/2022, 02:08Quote from AdminTC on 15/12/2021, 11:09You might also want to add the DataTable block to see tha data coming from the Waterfall block:
Hi,
-In above diagram, if I change the average in spectrum block (1-1000,000) do I see the changes in the Waterfall data as well?
Quote from AdminTC on 15/12/2021, 11:09You might also want to add the DataTable block to see tha data coming from the Waterfall block:
-In above diagram, if I change the average in spectrum block (1-1000,000) do I see the changes in the Waterfall data as well?
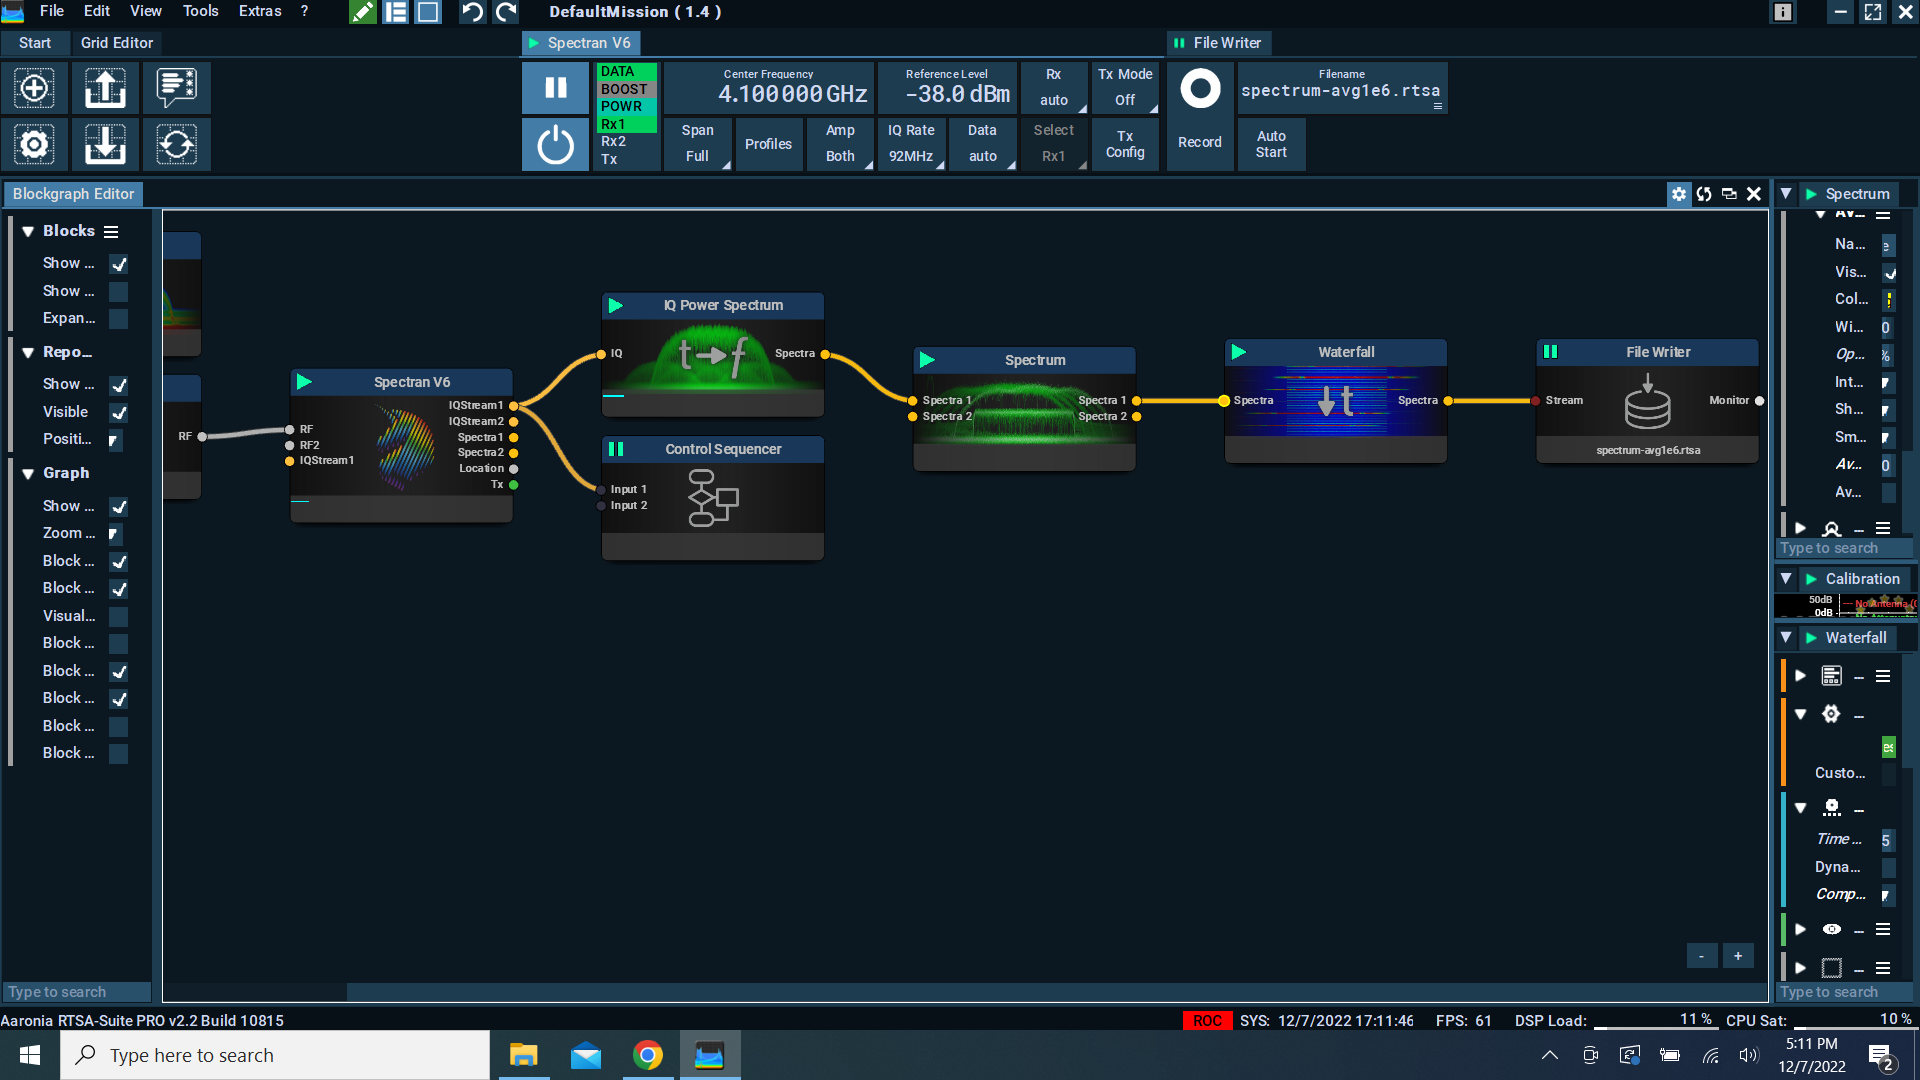
Quote from aminucd on 08/12/2022, 02:13-Can I take data from Spectrum --> Waterfall in Real time mode as well? see below diagram
-Can I take data from Spectrum --> Waterfall in Real time mode as well? see below diagram
Uploaded files:
Quote from aminucd on 08/12/2022, 22:42Hi,
Using the File Writer, I want to save the Spectrum data (e.g. average samples=100,000) in Waterfall format (e.g. time compression=100). How should I connect the blocks?
Thanks
Hi,
Using the File Writer, I want to save the Spectrum data (e.g. average samples=100,000) in Waterfall format (e.g. time compression=100). How should I connect the blocks?
Thanks
Quote from mm_dev on 09/12/2022, 09:34Quote from aminucd on 08/12/2022, 22:42Hi,
Using the File Writer, I want to save the Spectrum data (e.g. average samples=100,000) in Waterfall format (e.g. time compression=100). How should I connect the blocks?
You don't need the Waterfall just for compression as the Spectrum block also has a time compression setting which does the same as in the Waterfall. They only visualize the data differently, the data you get on the output has the same format. Only if the maximum time compression value of 100000 is too low for your use-case you'd have to chain two blocks in a row (doesn't really matter if Spectrum or Waterfall).
Please note that the output of the Spectrum block forwards the incoming data (optionally compressed/filtered based on setting in the "Main" group), not any particular trace. So the "Average Samples" setting of the Average trace does not apply to the data you get on the Spectra output if you expected that. But the time compression setting basically does the same if you adjust the compression mode setting as well.
Quote from aminucd on 08/12/2022, 22:42Hi,
Using the File Writer, I want to save the Spectrum data (e.g. average samples=100,000) in Waterfall format (e.g. time compression=100). How should I connect the blocks?
You don't need the Waterfall just for compression as the Spectrum block also has a time compression setting which does the same as in the Waterfall. They only visualize the data differently, the data you get on the output has the same format. Only if the maximum time compression value of 100000 is too low for your use-case you'd have to chain two blocks in a row (doesn't really matter if Spectrum or Waterfall).
Please note that the output of the Spectrum block forwards the incoming data (optionally compressed/filtered based on setting in the "Main" group), not any particular trace. So the "Average Samples" setting of the Average trace does not apply to the data you get on the Spectra output if you expected that. But the time compression setting basically does the same if you adjust the compression mode setting as well.