How to use the SPECTRAN V6 via Matlab
Quote from AdminTC on 05/12/2020, 10:02Since the RTSA-Suite PRO software offers a powerful HTTP Server block which supports JSON data format, it is quite simple to set up a live HTTP connection to Matlab by using its RESTful webservice: https://de.mathworks.com/help/matlab/ref/webread.html
Additional information on how to convert JSON text from a server is shown here: https://de.mathworks.com/help/compiler_sdk/mps_dev_test/mps.json.decoderesponse.html?searchHighlight=json&s_tid=srchtitle
And finally how to send and receive HTTP messages is shown here:
https://de.mathworks.com/help/matlab/ref/matlab.net.http.requestmessage.send.html
All needed documentation concerning our data structure and the command set are found under:
https://v6-forum.aaronia.de/forum/topic/rtsa-suite-pro-http-streaming/
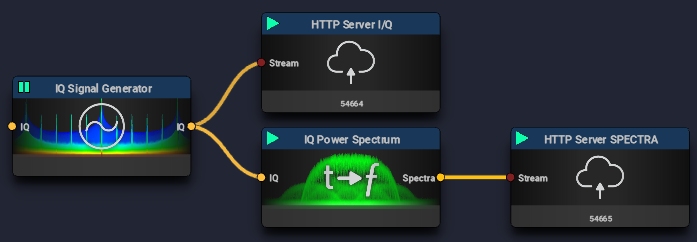
For a first implementation test you might want to use the I/Q Signal Generator block which provides I/Q and/or SPECTRA data.
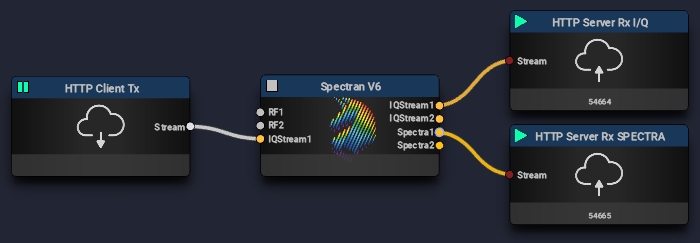
A simple setup for a full Rx and Tx SPECTRAN V6 remote interface looks like this (see attached files) including I/Q and/or SPECTRA data streaming.
Please feel free to post your sample Matlab setups.
Since the RTSA-Suite PRO software offers a powerful HTTP Server block which supports JSON data format, it is quite simple to set up a live HTTP connection to Matlab by using its RESTful webservice: https://de.mathworks.com/help/matlab/ref/webread.html
Additional information on how to convert JSON text from a server is shown here: https://de.mathworks.com/help/compiler_sdk/mps_dev_test/mps.json.decoderesponse.html?searchHighlight=json&s_tid=srchtitle
And finally how to send and receive HTTP messages is shown here:
https://de.mathworks.com/help/matlab/ref/matlab.net.http.requestmessage.send.html
All needed documentation concerning our data structure and the command set are found under:
https://v6-forum.aaronia.de/forum/topic/rtsa-suite-pro-http-streaming/
For a first implementation test you might want to use the I/Q Signal Generator block which provides I/Q and/or SPECTRA data.
A simple setup for a full Rx and Tx SPECTRAN V6 remote interface looks like this (see attached files) including I/Q and/or SPECTRA data streaming.
Please feel free to post your sample Matlab setups.
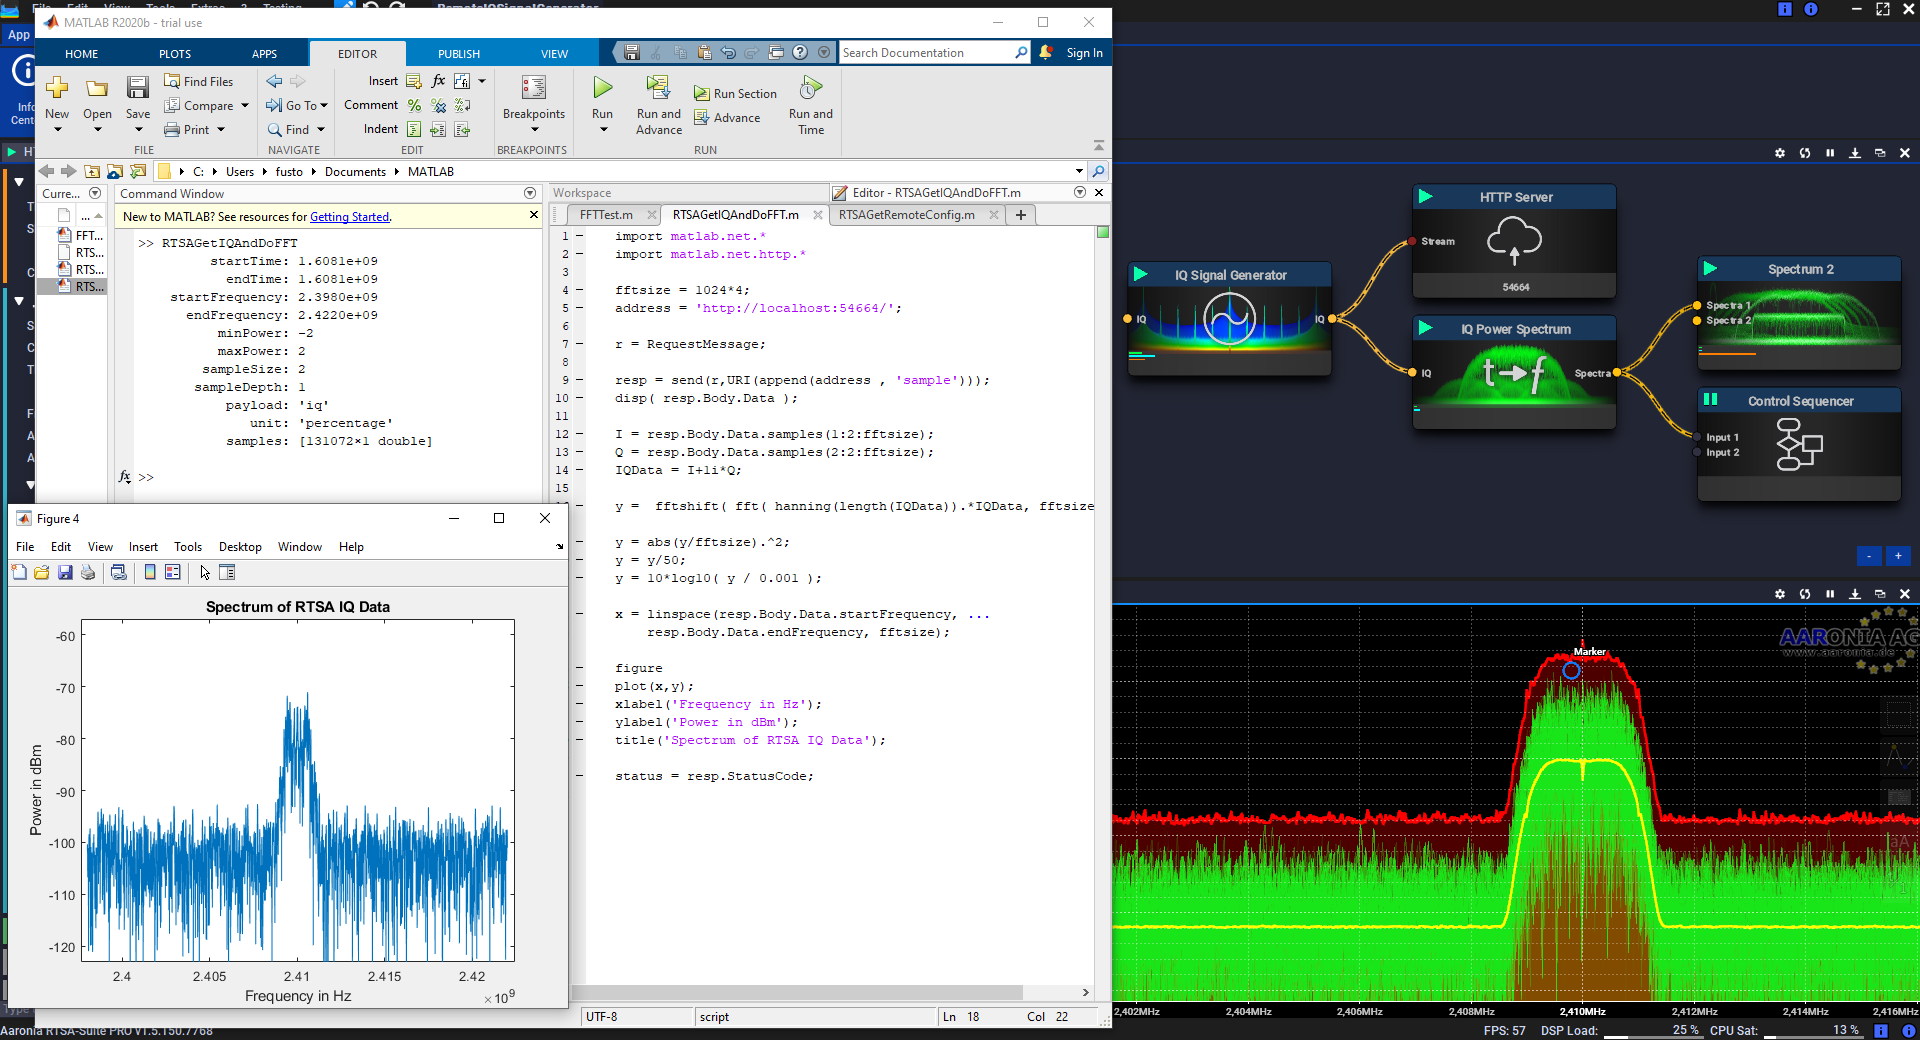
Uploaded files:Quote from DevSF on 16/12/2020, 12:25Attached is an easy Matlab example using the RTSA Suite PRO HTTP Server block interface:
- The Matlab script asks for IQ data from the RTSA Suite PRO and plots the spectrum.
- The RTSA Suite PRO mission runs the HTTP Server attached to the IQ Signal Generator block. The Control Sequencer block is used to automatically start the IQ Signal Generator after Mission load.
The Matlab script is quite simple and only consists of:
import matlab.net.*
import matlab.net.http.*fftsize = 1024*4;
address = 'http://localhost:54664/';r = RequestMessage;
resp = send(r,URI(append(address , 'sample')));
disp( resp.Body.Data );I = resp.Body.Data.samples(1:2:fftsize);
Q = resp.Body.Data.samples(2:2:fftsize);
IQData = I+1i*Q;y = fftshift( fft( hanning(length(IQData)).*IQData, fftsize ) ) ;
y = abs(y/fftsize).^2;
y = y/50;
y = 10*log10( y / 0.001 );x = linspace(resp.Body.Data.startFrequency, ...
resp.Body.Data.endFrequency, fftsize);figure
plot(x,y);
xlabel('Frequency in Hz');
ylabel('Power in dBm');
title('Spectrum of RTSA IQ Data');status = resp.StatusCode;
Attached is an easy Matlab example using the RTSA Suite PRO HTTP Server block interface:
- The Matlab script asks for IQ data from the RTSA Suite PRO and plots the spectrum.
- The RTSA Suite PRO mission runs the HTTP Server attached to the IQ Signal Generator block. The Control Sequencer block is used to automatically start the IQ Signal Generator after Mission load.
The Matlab script is quite simple and only consists of:
import matlab.net.*
import matlab.net.http.*fftsize = 1024*4;
address = 'http://localhost:54664/';r = RequestMessage;
resp = send(r,URI(append(address , 'sample')));
disp( resp.Body.Data );I = resp.Body.Data.samples(1:2:fftsize);
Q = resp.Body.Data.samples(2:2:fftsize);
IQData = I+1i*Q;y = fftshift( fft( hanning(length(IQData)).*IQData, fftsize ) ) ;
y = abs(y/fftsize).^2;
y = y/50;
y = 10*log10( y / 0.001 );x = linspace(resp.Body.Data.startFrequency, ...
resp.Body.Data.endFrequency, fftsize);figure
plot(x,y);
xlabel('Frequency in Hz');
ylabel('Power in dBm');
title('Spectrum of RTSA IQ Data');status = resp.StatusCode;
Uploaded files:
Quote from DevSF on 09/01/2021, 11:50There was a mistake with the IQ data extraction (length was too short).
Here is an improved version with a dynamic FFT size, I also normalized the values with the weight of the window function to get more amplitude accuracy for the dBm values:
import matlab.net.*
import matlab.net.http.*address = 'http://localhost:54664/';
r = RequestMessage;
resp = send(r,URI(append(address , 'sample')));
disp( resp.Body.Data );fftsize = 2^nextpow2(length(resp.Body.Data.samples)/2);
I = resp.Body.Data.samples(1:2:fftsize*2);
Q = resp.Body.Data.samples(2:2:fftsize*2);
IQData = I+1i*Q;fftWindow = hann(fftsize);
fftWindow = fftWindow*fftsize/sum(fftWindow);y = fftshift( fft( IQData.*fftWindow, fftsize ) ) ;
y = (abs(y/fftsize)).^2;
y = y/50;
y = 10*log10( y / 0.001 );x = linspace(resp.Body.Data.startFrequency, ...
resp.Body.Data.endFrequency, fftsize);plot(x,y);
xlabel('Frequency in Hz');
ylabel('Power in dBm');
title('Spectrum of RTSA IQ Data');status = resp.StatusCode;
There was a mistake with the IQ data extraction (length was too short).
Here is an improved version with a dynamic FFT size, I also normalized the values with the weight of the window function to get more amplitude accuracy for the dBm values:
import matlab.net.*
import matlab.net.http.*address = 'http://localhost:54664/';
r = RequestMessage;
resp = send(r,URI(append(address , 'sample')));
disp( resp.Body.Data );fftsize = 2^nextpow2(length(resp.Body.Data.samples)/2);
I = resp.Body.Data.samples(1:2:fftsize*2);
Q = resp.Body.Data.samples(2:2:fftsize*2);
IQData = I+1i*Q;fftWindow = hann(fftsize);
fftWindow = fftWindow*fftsize/sum(fftWindow);y = fftshift( fft( IQData.*fftWindow, fftsize ) ) ;
y = (abs(y/fftsize)).^2;
y = y/50;
y = 10*log10( y / 0.001 );x = linspace(resp.Body.Data.startFrequency, ...
resp.Body.Data.endFrequency, fftsize);plot(x,y);
xlabel('Frequency in Hz');
ylabel('Power in dBm');
title('Spectrum of RTSA IQ Data');status = resp.StatusCode;
Quote from DevSF on 09/01/2021, 12:09I attached a small Matlab class which may give you a small kick start to communicate with the HTTP Server block.
Copy the attached “AaroniaHTTP.m” file next to your Matlab script and you are ready to go.
The AaroniaHTTP class is instantiated with the address of the HTTP Server and can be further used to ask the HTTP Server for the remote configuration of the attached RTSA Suite blocks:
RTSASuite = AaroniaHTTP('http://localhost:54664/');
[remoteConfig, statusCode] = RTSASuite.getRemoteConfig();
disp(jsonencode(remoteConfig));
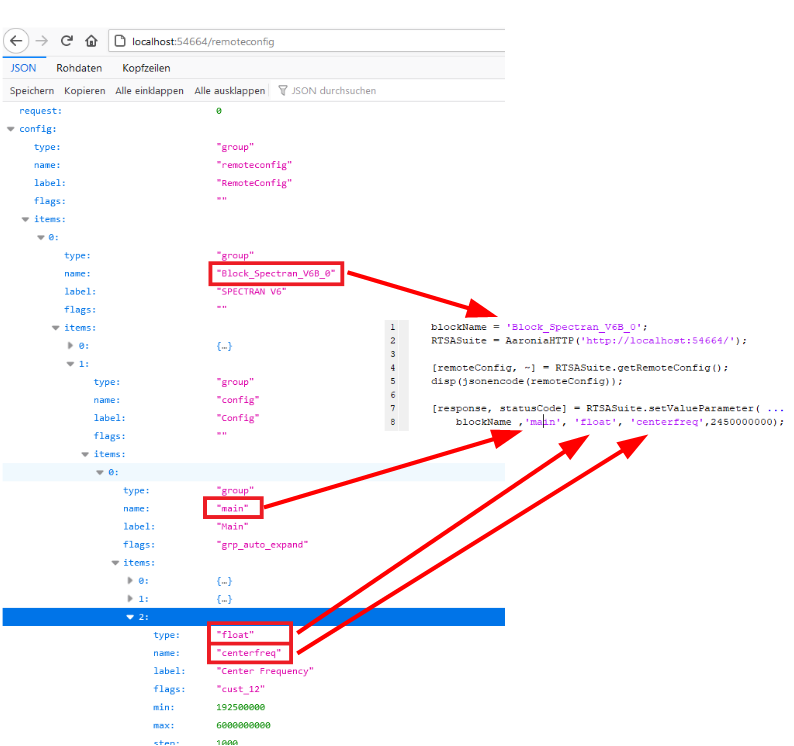
Typing the HTTP endpoint http://localhost:54664/remoteconfig in your web browser will get you the same remote configuration in JSON Format. To change a value in one RTSA Suite block of your RTSA Suite Mission you need to put a HTTP request with the same JSON structure of the related field back to to the RTSA Suite (see attached screenshot).
The method setValueParameter(...) of the AaroniaHTTP class will create this JSON structure and sends it to the HTTP Server block.
[response, statusCode] = RTSASuite.setValueParameter( ...
'Block_Spectran_V6B_0' ,'main', 'float', 'centerfreq',200000000);
This HTTP put request will have following JSON Structure:
{
"receivername":"Block_Spectran_V6B_0"
"config":{
"name":"Block_Spectran_V6B_0",
"type":"group",
"items":[{
"name":"main",
"type":"group",
"items":[{
"type":"float",
"name":"centerfreq",
"value":2.0E+8}
]}
]},
}Update 1. August 2023:
- Fix the configuration structures since the HTTP Server is more strict in the accepted structures
- Add getStreamPacket mehod for continous data streaming as added by DevDW, also an example was posted by him here.
I attached a small Matlab class which may give you a small kick start to communicate with the HTTP Server block.
Copy the attached “AaroniaHTTP.m” file next to your Matlab script and you are ready to go.
The AaroniaHTTP class is instantiated with the address of the HTTP Server and can be further used to ask the HTTP Server for the remote configuration of the attached RTSA Suite blocks:
RTSASuite = AaroniaHTTP('http://localhost:54664/');
[remoteConfig, statusCode] = RTSASuite.getRemoteConfig();
disp(jsonencode(remoteConfig));
Typing the HTTP endpoint http://localhost:54664/remoteconfig in your web browser will get you the same remote configuration in JSON Format. To change a value in one RTSA Suite block of your RTSA Suite Mission you need to put a HTTP request with the same JSON structure of the related field back to to the RTSA Suite (see attached screenshot).
The method setValueParameter(...) of the AaroniaHTTP class will create this JSON structure and sends it to the HTTP Server block.
[response, statusCode] = RTSASuite.setValueParameter( ...
'Block_Spectran_V6B_0' ,'main', 'float', 'centerfreq',200000000);
This HTTP put request will have following JSON Structure:
{
"receivername":"Block_Spectran_V6B_0"
"config":{
"name":"Block_Spectran_V6B_0",
"type":"group",
"items":[{
"name":"main",
"type":"group",
"items":[{
"type":"float",
"name":"centerfreq",
"value":2.0E+8}
]}
]},
}
Update 1. August 2023:
- Fix the configuration structures since the HTTP Server is more strict in the accepted structures
- Add getStreamPacket mehod for continous data streaming as added by DevDW, also an example was posted by him here.
Quote from DevSF on 09/01/2021, 12:24The following code will set some parameters in the Spectran V6 block, start the streaming and plots the FFT of the IQ Data:
blockName = 'Block_Spectran_V6B_0';
RTSASuite = AaroniaHTTP('http://localhost:54664/');%Get the Blockgraph configuration attached to the HTTP Server block
[remoteConfig, statusCode] = RTSASuite.getRemoteConfig();
disp(jsonencode(remoteConfig));%ask for the health status
[healthstatus, statusCode] = RTSASuite.getHealthStatus();
disp(jsonencode(healthstatus))%Set Spectran V6 paramater
[response, statusCode] = RTSASuite.setValueParameter( ...
blockName ,'main', 'float', 'centerfreq',200000000);
RTSASuite.setEnumParameter( blockName ,'calibration', 'preamp'...
,5 , 'Disabled,Auto,None,Amp,Preamp,Both');
RTSASuite.setEnumParameter( blockName ,'main', 'decimation'...
,1 , 'Full,1 / 2,1 / 4,1 / 8,1 / 16,1 / 32');%start the measurement and wait for it running
RTSASuite.startStreaming();
pause(5);%Get IQ Data Packet
IQPacket = RTSASuite.getSamplePacket();
IQData = RTSASuite.getIQFromPacket(IQPacket);%plot the result
whos IQData;fftsize = 2^nextpow2(length(IQData));
if(fftsize > 1)
fftWindow = hann(fftsize)*2;
y = fftshift( fft( IQData(1:fftsize).*fftWindow, fftsize ) ) ;y = abs(y/fftsize).^2;
y = y/50;
y = 10*log10( y / 0.001 );x = linspace(IQPacket.startFrequency, ...
IQPacket.endFrequency, fftsize);%figure
plot(x,y);
xlabel('Frequency in Hz');
ylabel('Power in dBm');
title('Spectrum of RTSA IQ Data');
else
disp('No data to plot');
end
The following code will set some parameters in the Spectran V6 block, start the streaming and plots the FFT of the IQ Data:

blockName = 'Block_Spectran_V6B_0';
RTSASuite = AaroniaHTTP('http://localhost:54664/');%Get the Blockgraph configuration attached to the HTTP Server block
[remoteConfig, statusCode] = RTSASuite.getRemoteConfig();
disp(jsonencode(remoteConfig));%ask for the health status
[healthstatus, statusCode] = RTSASuite.getHealthStatus();
disp(jsonencode(healthstatus))%Set Spectran V6 paramater
[response, statusCode] = RTSASuite.setValueParameter( ...
blockName ,'main', 'float', 'centerfreq',200000000);
RTSASuite.setEnumParameter( blockName ,'calibration', 'preamp'...
,5 , 'Disabled,Auto,None,Amp,Preamp,Both');
RTSASuite.setEnumParameter( blockName ,'main', 'decimation'...
,1 , 'Full,1 / 2,1 / 4,1 / 8,1 / 16,1 / 32');%start the measurement and wait for it running
RTSASuite.startStreaming();
pause(5);%Get IQ Data Packet
IQPacket = RTSASuite.getSamplePacket();
IQData = RTSASuite.getIQFromPacket(IQPacket);%plot the result
whos IQData;fftsize = 2^nextpow2(length(IQData));
if(fftsize > 1)
fftWindow = hann(fftsize)*2;
y = fftshift( fft( IQData(1:fftsize).*fftWindow, fftsize ) ) ;y = abs(y/fftsize).^2;
y = y/50;
y = 10*log10( y / 0.001 );x = linspace(IQPacket.startFrequency, ...
IQPacket.endFrequency, fftsize);%figure
plot(x,y);
xlabel('Frequency in Hz');
ylabel('Power in dBm');
title('Spectrum of RTSA IQ Data');
else
disp('No data to plot');
end
Uploaded files:
Quote from DevSF on 09/01/2021, 12:29Depending on your case you may want to re-play Aaronia RTSA Suite records and get the data in Matlab.
You can also use the AaroniaHTTP class to control the File Reader block in a Mission.
The following code snippet will set the path to a record file, starts the File Reader Block and asks for multiple data packets:
recordFile = 'C:/Data/test.rtsa';
blockName = 'Block_FileReader_0';
RTSASuite = AaroniaHTTP('http://localhost:54664/');%Set Record File, Start replaying and wait for running
RTSASuite.setFileParameter( blockName ,'', 'filename', recordFile);
RTSASuite.startStreaming();
pause(1);%Get multiple IQ Data Packets
packetCount = 10;
IQData = [];for i = 1:packetCount
IQPacket = RTSASuite.getSamplePacket();
IQData = [IQData RTSASuite.getIQFromPacket(IQPacket)];
endwhos IQData;
Depending on your case you may want to re-play Aaronia RTSA Suite records and get the data in Matlab.
You can also use the AaroniaHTTP class to control the File Reader block in a Mission.

The following code snippet will set the path to a record file, starts the File Reader Block and asks for multiple data packets:
recordFile = 'C:/Data/test.rtsa';
blockName = 'Block_FileReader_0';
RTSASuite = AaroniaHTTP('http://localhost:54664/');%Set Record File, Start replaying and wait for running
RTSASuite.setFileParameter( blockName ,'', 'filename', recordFile);
RTSASuite.startStreaming();
pause(1);%Get multiple IQ Data Packets
packetCount = 10;
IQData = [];for i = 1:packetCount
IQPacket = RTSASuite.getSamplePacket();
IQData = [IQData RTSASuite.getIQFromPacket(IQPacket)];
endwhos IQData;
Uploaded files:
Quote from user8542 on 24/02/2021, 03:49How fast can data be streamed over this HTTP interface?
Is there a way to interface the SPECTRAN V6 with DSP System Toolbox for real time streaming input and output?
How fast can data be streamed over this HTTP interface?
Is there a way to interface the SPECTRAN V6 with DSP System Toolbox for real time streaming input and output?
Quote from AdminTC on 24/02/2021, 10:16We are speaking about something around 200µs: https://v6-forum.aaronia.de/forum/topic/overall-processing-delay-rx-to-tx/
So far we don't offer a customer support for programing the internal SPECTRAN V6 FPGA (I think that is what you are up to?) but the upcoming SPECTRAN V6 PRO for sure will offer some additional FPGA programming possibilities for customer.
We are speaking about something around 200µs: https://v6-forum.aaronia.de/forum/topic/overall-processing-delay-rx-to-tx/
So far we don't offer a customer support for programing the internal SPECTRAN V6 FPGA (I think that is what you are up to?) but the upcoming SPECTRAN V6 PRO for sure will offer some additional FPGA programming possibilities for customer.
Quote from DevSF on 24/02/2021, 11:02Hi,
I think he is talking about an example for a data source block in Simulink (part of the DSP System Toolbox).
For real time operations in Simulink for example, best would be to integrate C++ code into a custom Simulink block and use the stream HTTP endpoint with a binary data format. This example is asking for data samples and is not getting a continuous data stream of IQ data in real time.
Hi,
I think he is talking about an example for a data source block in Simulink (part of the DSP System Toolbox).
For real time operations in Simulink for example, best would be to integrate C++ code into a custom Simulink block and use the stream HTTP endpoint with a binary data format. This example is asking for data samples and is not getting a continuous data stream of IQ data in real time.


