Are IQ samples missed while capturing the data?
Quote from abhijithbg on 02/07/2022, 14:45Hi Aaronia team,
I am trying to demodulate a 5 MHz signal which is captured from the Spectran V6 using simple IQ recorder mode. (reference: https://v6-forum.aaronia.de/forum/topic/simply-iq-recorder/). I have put time to frequency converter block and observing spectrum plot for just for confirming (find the attached mission file).
These are the Spectrn Pro status: Only Rx1 is ON with full span. No USB underrun/overrun observed. Ensured that the DSP load and CPU load doesn't cross 70%.
Here are my observations:
- The spectrum outside the 5MHz band jumps every now and then (observed in the IQ power spectrum).
- When the signal is plotted in the spectrogram of Matlab (plot using spectrum analyzer), there are spurs at various time points.
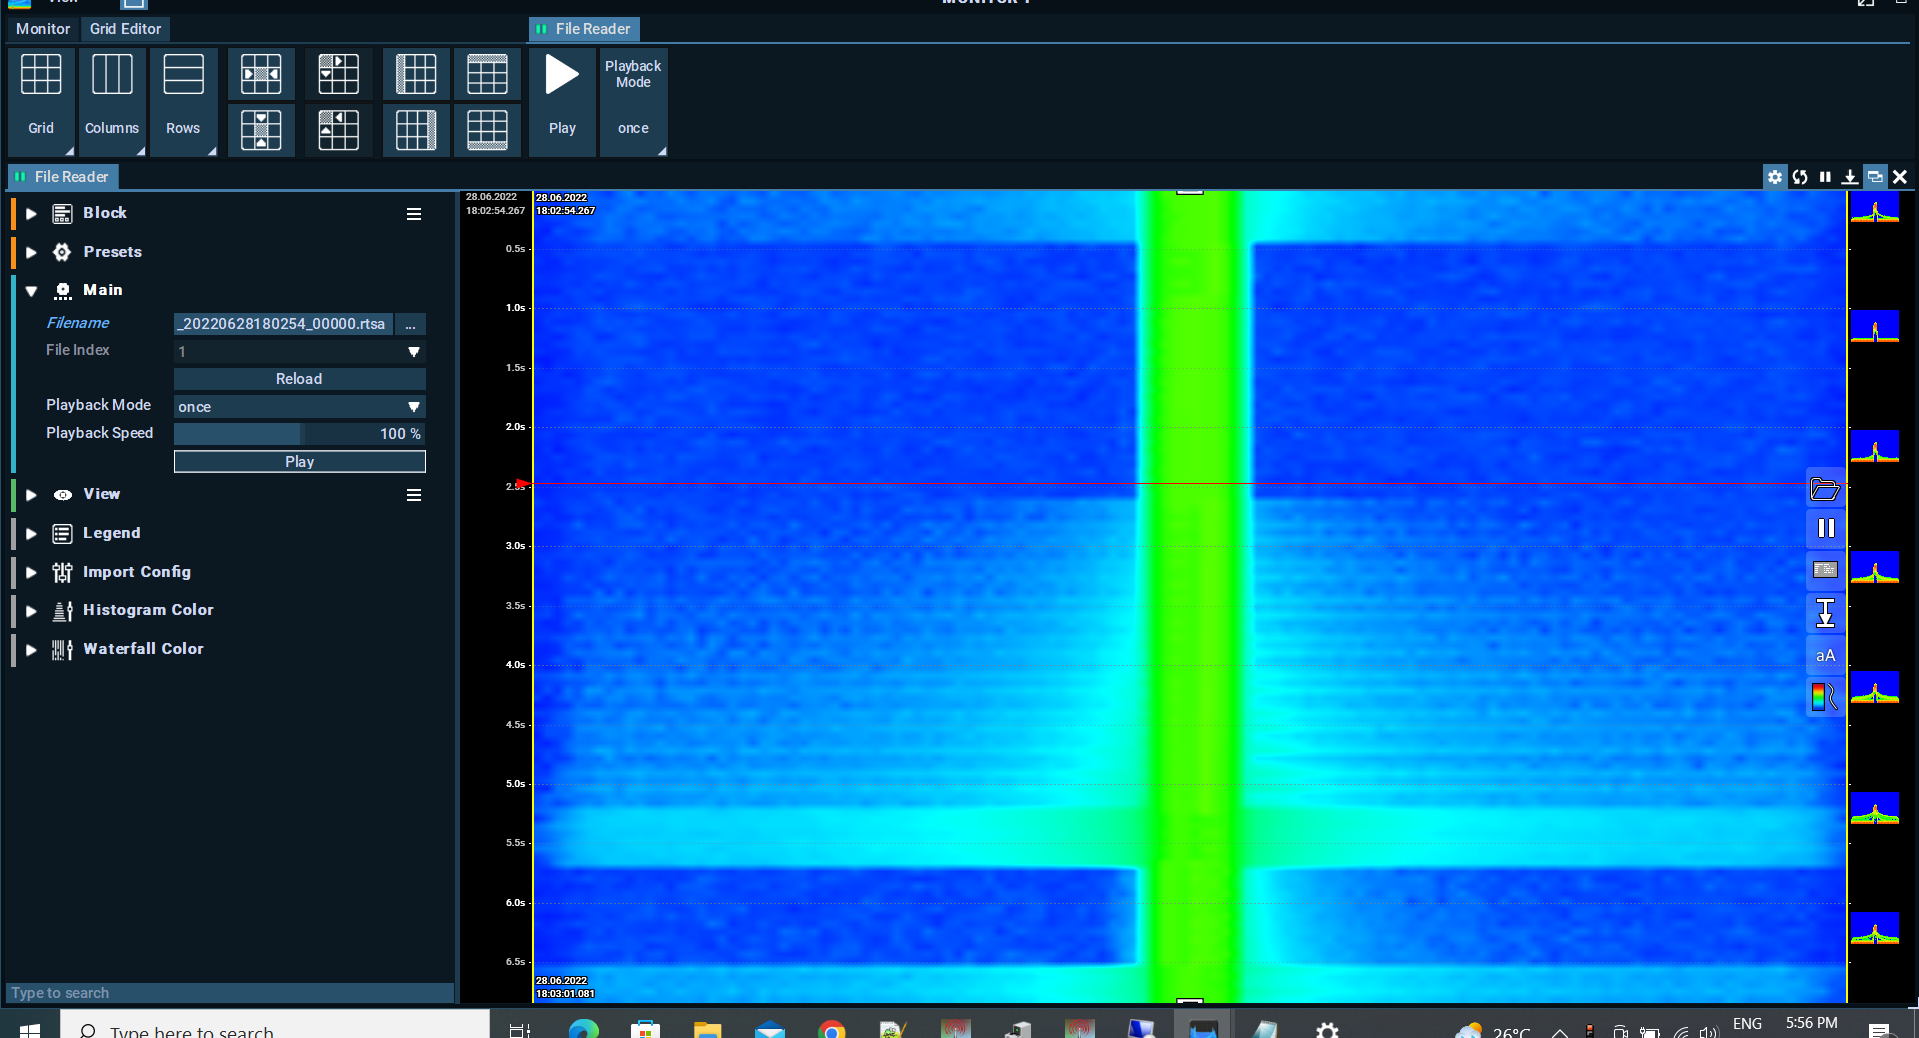
- When the signal is read back ( I avoided using spectrogram in this mission to save resources on the CPU) using file reader, the energy outside the 5MHz BW is visible.
- The signal from the generator is clean as seen with competitor signal analyzer.
Attachments:
- Mission file
- IQ capture spectrum screenshot (video is sent over email).
- Matlab spectrogram plot
- Aaronia spectrogram plot using file reader.
- Competitor Spectrum Analyzer plot to show the signal do not have issue .
Kindly help me here, on what is going wrong.
Thanks
Hi Aaronia team,
I am trying to demodulate a 5 MHz signal which is captured from the Spectran V6 using simple IQ recorder mode. (reference: https://v6-forum.aaronia.de/forum/topic/simply-iq-recorder/). I have put time to frequency converter block and observing spectrum plot for just for confirming (find the attached mission file).
These are the Spectrn Pro status: Only Rx1 is ON with full span. No USB underrun/overrun observed. Ensured that the DSP load and CPU load doesn't cross 70%.
Here are my observations:
- The spectrum outside the 5MHz band jumps every now and then (observed in the IQ power spectrum).
- When the signal is plotted in the spectrogram of Matlab (plot using spectrum analyzer), there are spurs at various time points.
- When the signal is read back ( I avoided using spectrogram in this mission to save resources on the CPU) using file reader, the energy outside the 5MHz BW is visible.
- The signal from the generator is clean as seen with competitor signal analyzer.
Attachments:
- Mission file
- IQ capture spectrum screenshot (video is sent over email).
- Matlab spectrogram plot
- Aaronia spectrogram plot using file reader.
- Competitor Spectrum Analyzer plot to show the signal do not have issue .
Kindly help me here, on what is going wrong.
Thanks
Uploaded files: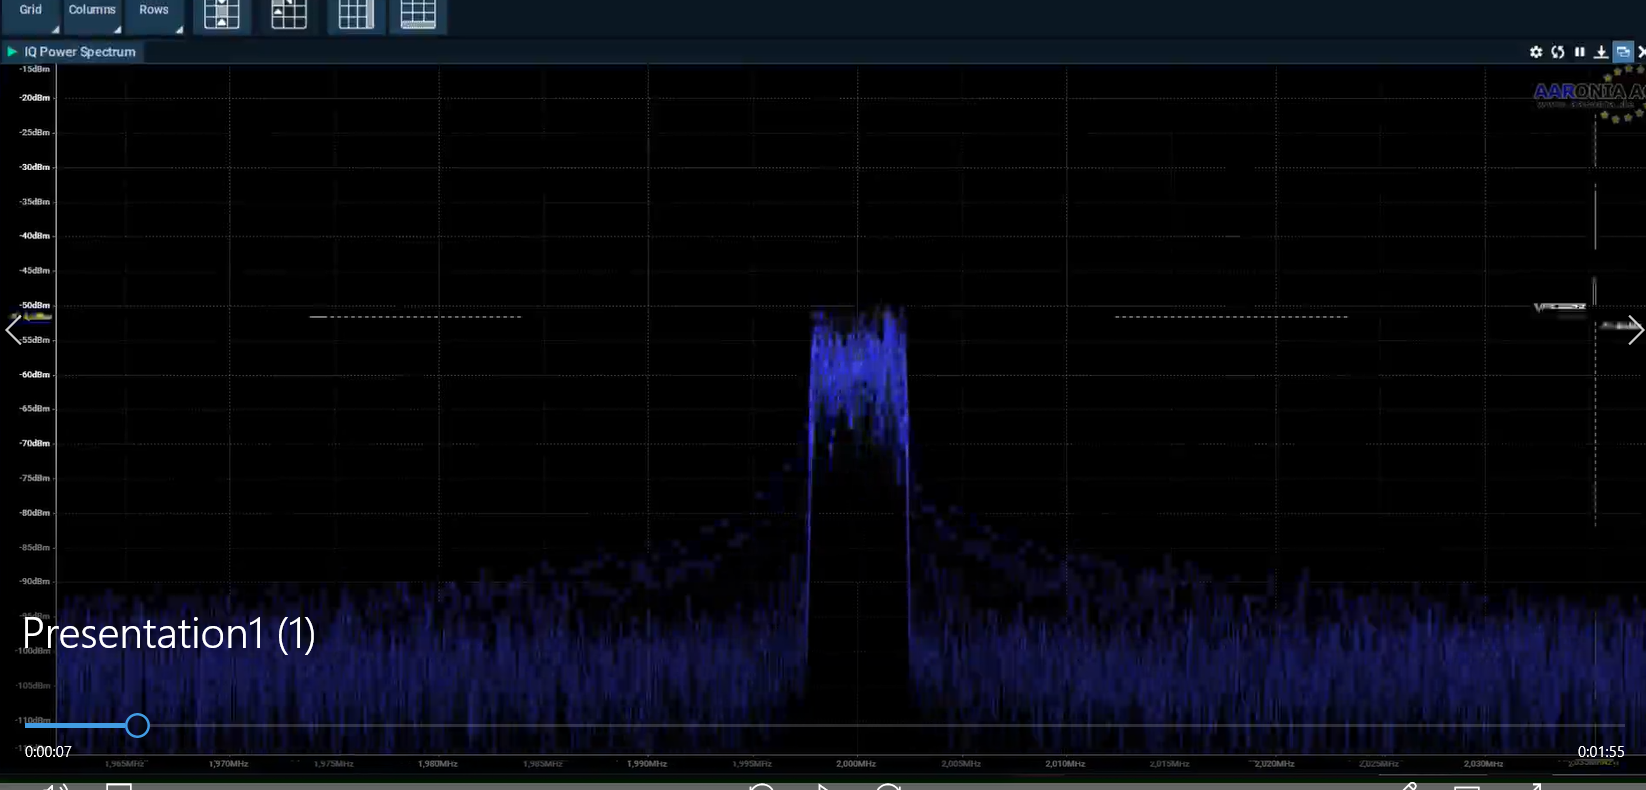


Quote from AdminTC on 03/07/2022, 11:08Looks like PC limitations!
Lower the bandwidth (data amount) e.g. use a SPAN of 1/2 or 1/4 and remove the IQ Power Spectrum block.
Do you then get a clean recording?
Looks like PC limitations!
Lower the bandwidth (data amount) e.g. use a SPAN of 1/2 or 1/4 and remove the IQ Power Spectrum block.
Do you then get a clean recording?
Quote from abhijithbg on 18/07/2022, 06:42Reducing the span to 1/2 and 1/4 made it to work.
IQ power spectrum block was used turned off anyway.
Thanks
Reducing the span to 1/2 and 1/4 made it to work.
IQ power spectrum block was used turned off anyway.
Thanks